-sumat-
Description
-sumat- is a flexible tool to generate survey tables. It differs from existing tools in that more statistics are possible to report and in that the summary table is saved for further data handling.
-sumat- is integrated with -matprint- such that styling in smcl, html, latex, csv and markdown is quite easy.
With option hide, it is possible to report values based on Pseudo percentiles.
Installation
To install use the command: ssc install matrixtools
Demonstration
The example dataset
sysuse auto, clear
label define rep78 1 "1 repair" 2 "2 repairs" 3 "3 repairs" 4 "4 repairs" 5 "5 repairs"
label values rep78 rep78
Using -sumat-
To get a matrix with statistics n, missing, unique, mean, sd, and ci for the variables price, foreign and rep78:
sumat price mpg, statistics(n missing unique mean sd ci) decimals((0,2,0,0,2))
--------------------------------------------------------------------
               n  missing  unique  mean       sd  ci95% lb  ci95% ub
--------------------------------------------------------------------
Price         74     0.00      74  6165  2949.50   5493.24   6837.27
Mileage(mpg)  74     0.00      21    21     5.79     19.98     22.62
--------------------------------------------------------------------
The result is stored in r(sumat) for further use:
return list
matrices:
              r(sumat) :  2 x 7
-sumat- is integrated with -matprint- and hence the result can be styled accordingly.
The requested statistics can be reported columnwise by a categorical variable
sumat price mpg, statistics(n mean ci) colby(foreign)
-----------------------------------------------------------------------------------------------------------------
              Car origin(Domestic)                               Car origin(Foreign)
                                 n     mean  ci95% lb  ci95% ub                    n     mean  ci95% lb  ci95% ub
-----------------------------------------------------------------------------------------------------------------
Price                        52.00  6072.42   5230.64   6914.21                22.00  6384.68   5289.07   7480.29
Mileage(mpg)                 52.00    19.83     18.54     21.12                22.00    24.77     22.01     27.54
-----------------------------------------------------------------------------------------------------------------
rowwise by a categorical variable
sumat price mpg, statistics(n mean ci) rowby(foreign)
----------------------------------------------------------------------
                                        n     mean  ci95% lb  ci95% ub
----------------------------------------------------------------------
Car origin(Domestic)  Price         52.00  6072.42   5230.64   6914.21
                      Mileage(mpg)  52.00    19.83     18.54     21.12
Car origin(Foreign)   Price         22.00  6384.68   5289.07   7480.29
                      Mileage(mpg)  22.00    24.77     22.01     27.54
----------------------------------------------------------------------
or both by two categorical variables.
sumat price mpg, statistics(n mean ci) rowby(rep78) colby(foreign)
------------------------------------------------------------------------------------------------------------------------------------------------
                                             Car origin(Domestic)                               Car origin(Foreign)
                                                                n     mean  ci95% lb  ci95% ub                    n     mean  ci95% lb  ci95% ub
------------------------------------------------------------------------------------------------------------------------------------------------
Repair record 1978(1 repair)   Price                         2.00  4564.50   3840.29   5288.71                 0.00
                               Mileage(mpg)                  2.00    21.00     15.12     26.88                 0.00
Repair record 1978(2 repairs)  Price                         8.00  5967.63   3487.30   8447.95                 0.00
                               Mileage(mpg)                  8.00    19.13     16.52     21.73                 0.00
Repair record 1978(3 repairs)  Price                        27.00  6607.07   5226.06   7988.09                 3.00  4828.67   3373.89   6283.45
                               Mileage(mpg)                 27.00    19.00     17.46     20.54                 3.00    23.33     20.49     26.18
Repair record 1978(4 repairs)  Price                         9.00  5881.56   4841.46   6921.66                 9.00  6261.44   5022.69   7500.20
                               Mileage(mpg)                  9.00    18.44     15.45     21.44                 9.00    24.89     23.12     26.66
Repair record 1978(5 repairs)  Price                         2.00  4204.50   3772.33   4636.67                 9.00  6292.67   4485.82   8099.51
                               Mileage(mpg)                  2.00    32.00     28.08     35.92                 9.00    26.33     20.21     32.45
------------------------------------------------------------------------------------------------------------------------------------------------
Labels can be turned off:
sumat price mpg, statistics(n mean ci) rowby(rep78) colby(foreign) nolabel
-------------------------------------------------------------------------------------------------
                 foreign(0)                               foreign(1)
                          n     mean  ci95% lb  ci95% ub           n     mean  ci95% lb  ci95% ub
-------------------------------------------------------------------------------------------------
rep78(1)  price        2.00  4564.50   3840.29   5288.71        0.00
          mpg          2.00    21.00     15.12     26.88        0.00
rep78(2)  price        8.00  5967.63   3487.30   8447.95        0.00
          mpg          8.00    19.13     16.52     21.73        0.00
rep78(3)  price       27.00  6607.07   5226.06   7988.09        3.00  4828.67   3373.89   6283.45
          mpg         27.00    19.00     17.46     20.54        3.00    23.33     20.49     26.18
rep78(4)  price        9.00  5881.56   4841.46   6921.66        9.00  6261.44   5022.69   7500.20
          mpg          9.00    18.44     15.45     21.44        9.00    24.89     23.12     26.66
rep78(5)  price        2.00  4204.50   3772.33   4636.67        9.00  6292.67   4485.82   8099.51
          mpg          2.00    32.00     28.08     35.92        9.00    26.33     20.21     32.45
-------------------------------------------------------------------------------------------------
Also totals can be added
sumat price mpg, statistics(n mean ci) rowby(rep78) colby(foreign) total
------------------------------------------------------------------------------------------------------------------------------------------------------------------------------------
                                             Car origin(Domestic)                               Car origin(Foreign)                               Total
                                                                n     mean  ci95% lb  ci95% ub                    n     mean  ci95% lb  ci95% ub      n     mean  ci95% lb  ci95% ub
------------------------------------------------------------------------------------------------------------------------------------------------------------------------------------
Repair record 1978(1 repair)   Price                         2.00  4564.50   3840.29   5288.71                 0.00                                2.00  4564.50   3840.29   5288.71
                               Mileage(mpg)                  2.00    21.00     15.12     26.88                 0.00                                2.00    21.00     15.12     26.88
Repair record 1978(2 repairs)  Price                         8.00  5967.63   3487.30   8447.95                 0.00                                8.00  5967.63   3487.30   8447.95
                               Mileage(mpg)                  8.00    19.13     16.52     21.73                 0.00                                8.00    19.13     16.52     21.73
Repair record 1978(3 repairs)  Price                        27.00  6607.07   5226.06   7988.09                 3.00  4828.67   3373.89   6283.45  30.00  6429.23   5167.80   7690.67
                               Mileage(mpg)                 27.00    19.00     17.46     20.54                 3.00    23.33     20.49     26.18  30.00    19.43     17.95     20.92
Repair record 1978(4 repairs)  Price                         9.00  5881.56   4841.46   6921.66                 9.00  6261.44   5022.69   7500.20  18.00  6071.50   5281.72   6861.28
                               Mileage(mpg)                  9.00    18.44     15.45     21.44                 9.00    24.89     23.12     26.66  18.00    21.67     19.39     23.95
Repair record 1978(5 repairs)  Price                         2.00  4204.50   3772.33   4636.67                 9.00  6292.67   4485.82   8099.51  11.00  5913.00   4367.21   7458.79
                               Mileage(mpg)                  2.00    32.00     28.08     35.92                 9.00    26.33     20.21     32.45  11.00    27.36     22.20     32.52
Total                          Price                        52.00  6072.42   5230.64   6914.21                22.00  6384.68   5289.07   7480.29  74.00  6165.26   5493.24   6837.27
                               Mileage(mpg)                 52.00    19.83     18.54     21.12                22.00    24.77     22.01     27.54  74.00    21.30     19.98     22.62
------------------------------------------------------------------------------------------------------------------------------------------------------------------------------------
Export to excel
The matrix can easily be reused in Excel by using -putexcel-.
In Stata 13 it looks like:
putexcel a1=matrix(r(sumat), names) using "delete_me13.xlsx", sheet(nhb, replace) replace
In Stata 14 it looks like:
putexcel set delete_me14.xlsx, replace
putexcel (a1) = matrix( r(sumat) ), names
Alternatively use option toxl
sumat price mpg, statistics(n mean ci) rowby(rep78) colby(foreign) ///
    toxl(deleteme.`suffix', nhb0, replace, 2,3  ,  (30,15))
Using -coefplot-
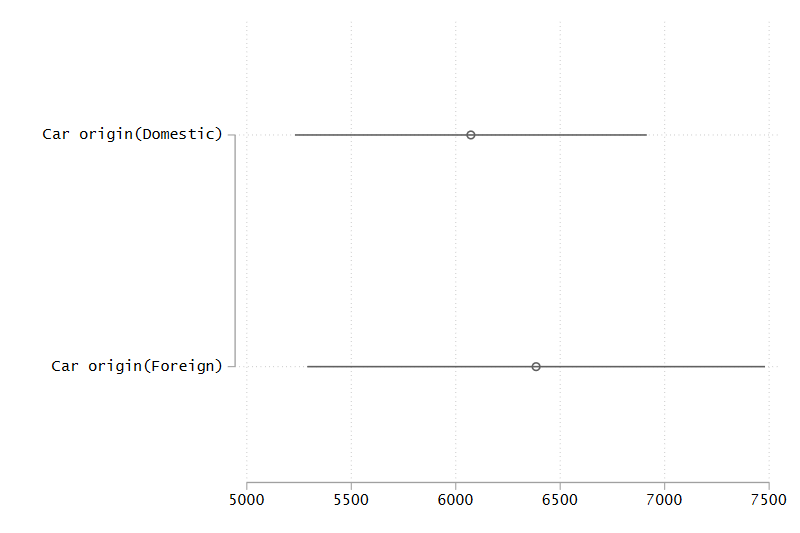
One can use the command -coefplot- to visualise ones findings, e.g. doing a mean and confindence interval plot for the variable price.
Use -sumat- to get the necessary and sufficient values for price:
sumat price, statistics(mean ci) rowby(foreign)
-------------------------------------------------
                         mean  ci95% lb  ci95% ub
-------------------------------------------------
Car origin(Domestic)  6072.42   5230.64   6914.21
Car origin(Foreign)   6384.68   5289.07   7480.29
-------------------------------------------------
Save and transpose the returned matrix for use in -coefplot-
matrix tmp = r(sumat)'
Create a mean and confidence interval plot by -coefplot-
coefplot matrix(tmp), ci((2 3))
Last update: 2022-04-21, Stata version 17